Being a developer, We are spending a lot of time in debugging besides writing code. If we can debug with speed, We can be more productive in our development. In this article, I would like to show you debugging tips and tricks.
Error-free code
We are generally debugging when we produce erroneous code. First, we should take care that we should not produce any buggy code. If we write an error-free code, We will not face a question of debugging.
There are three ways to prevent bugs:
- Follows coding standards
- Use simple expressive variable/function names
- Write single-purpose short functions
To write the error-free code, I personally insist to follow any coding standard. I personally prefer WordPress code standards. To check whether we are following code standard perfectly, We should use code standard checking tools. I personally use PHP Code Sniffer with WordPress Coding standard. The coding standard generates the consistent formation of the code.
Try to use simple and fully qualified function names. Instead of naming $p, We should make the function name $post. The $post name suggests that it holds the post object.
Break/Divide a code into more functions instead of writing all code in a single function. A Function should be written single purpose, and It should be as short as possible. An error can’t be hidden in a short function. An error can be hidden in a lengthy function code.
Code Linting
Break/Divide a code into more functions instead of writing all code in a single function. A Function should be written single purpose, and It should be as short as possible. An error can’t be hidden in a short function. An error can be hidden in a lengthy function code.
Advanced debugging with breakpoint
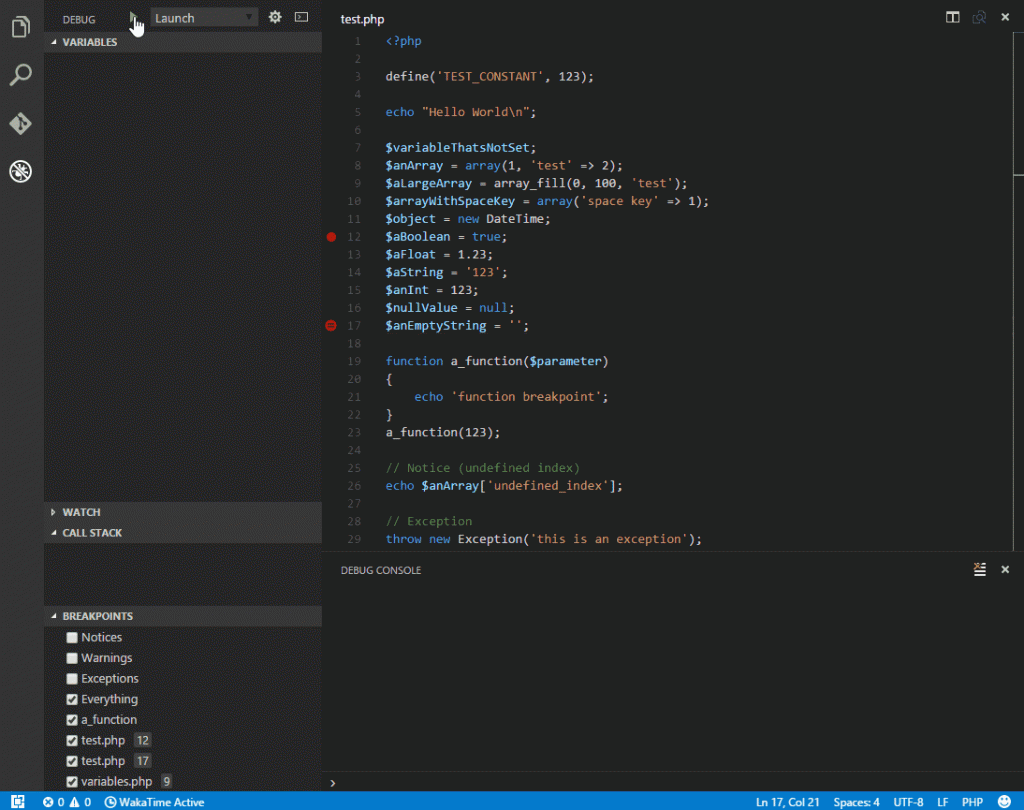
Do advanced debugging by using the breakpoint with the XDebug and Integrated Development Environment IDE Editor like VSCode. A Breakpoint pauses the execution and allows to inspect the code. For how to use XDdebug with the VSCode, Please visit the https://github.com/felixfbecker/vscode-php-debug

When control comes to the breakpoint, the execution pauses and allows us to inspect the code. We can do advanced debugging with breakpoint using the chrome dev tool. For how to use breakpoint with the chrome dev tool, Please visit the https://developers.google.com/web/tools/chrome-devtools/javascript/breakpoints
WP-Config constants
When you are developing in WordPress, Please make sure that below the constant value set in the root/wp-config.php file.
define( 'WP_DEBUG', true );
define( 'WP_DEBUG_LOG', __DIR__ . '/wp-content/prashant-11072021-FDFDFRGFDDFD.log' );
define( 'WP_DEBUG_DISPLAY', true );
If the above-mentioned constants are not set and you write any buggy code, You can not see any error.
WordPress plugin for debugging
- Query Monitor: Monitor SQL Queries, Query load time and AJAX request
- Debug Bar: Adds a debug menu to the admin bar that shows query, cache, and other helpful debugging information.
- Log Deprecated Notices: Logs the usage of deprecated files, functions, and function arguments
- User Switching: allows you to quickly swap between user accounts in WordPress at the click of a button
Leave a Reply